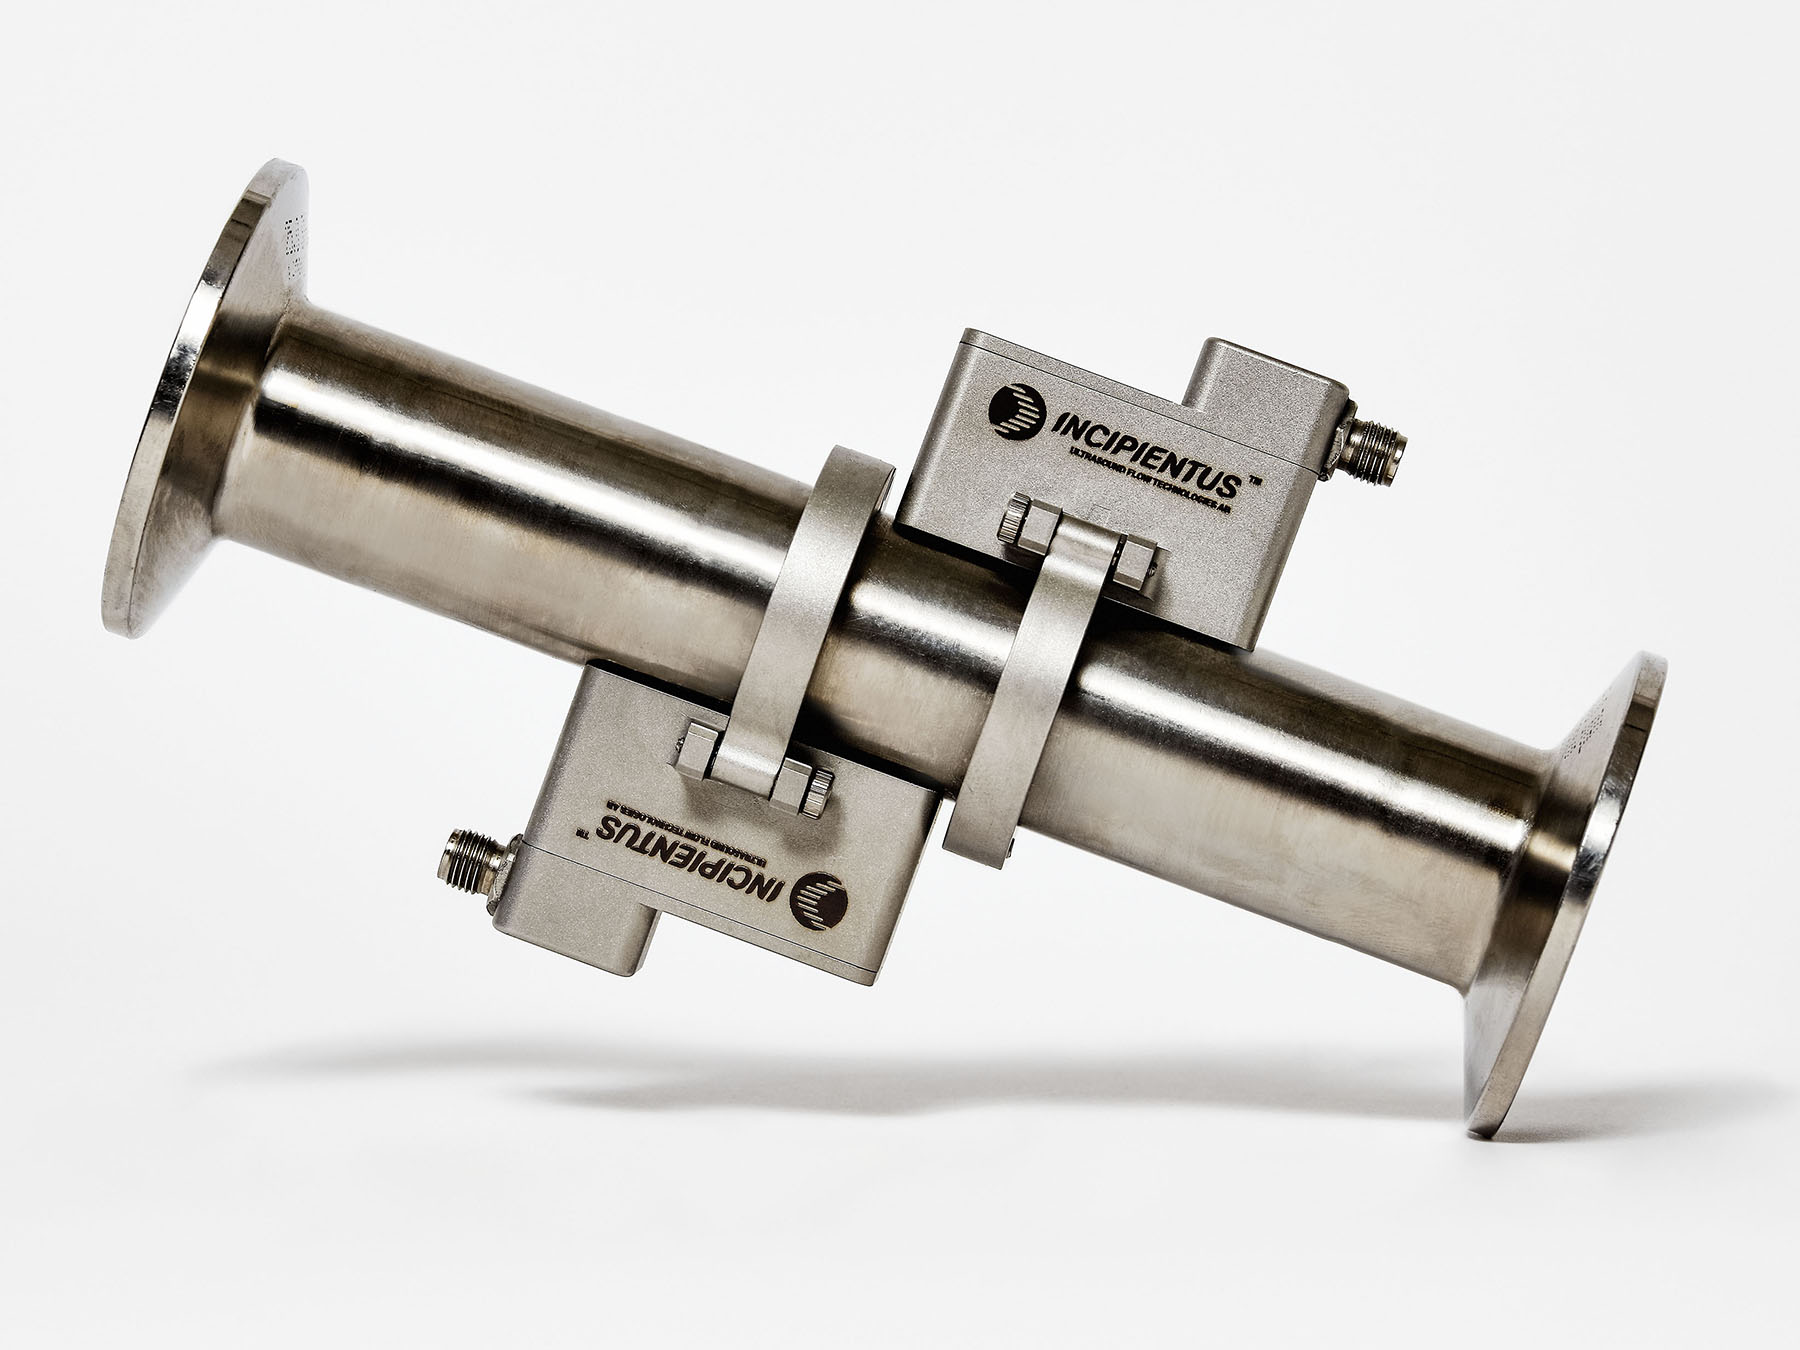
Press play to watch the technology video!

Measurement outputs
- Velocity profile
- Spectral images
- Shear rate distribution in pipe
- Shear stress distribution in pipe
- Viscosity distribution (shear stress / shear rate)
- Yield stress
- Volumetric flow rate
- Temperature
- Differential pressure
- Ultrasound velocity in liquids

Incipientus developed technology
Incipientus deliver continuous in-line viscosity and velocity profile process data using our patented touch-free sensor technology. Our touch-free sensors are installed directly in the production line so that our instruments can deliver real-time process data. Key technologies are Ultrasonic Velocity Profiling (UVP) and UVP in combination with Pressure Difference (UVP + PD). The science and technology behind our products and solutions are based on more than 20 years of research, protected by a multitude of international patents.
Ultrasound Velocity Profiling (UVP)
Incipientus instrument uses Ultrasonic Velocity Profiling (UVP) techniques to measure an instantaneous velocity profile in fluids across the ultrasonic beam axis.
A sensor transmits a short sinusoidal ultrasonic pulse through the pipe wall that travels along the measurement axis into the liquid flowing inside a pipe.
When the ultrasonic pulse hits a small moving particle/microbubble suspended in the flowing liquid, part of the ultrasound energy scatters back to the sensor.
The time interval between two successive pulses is used to determine the flow velocity. Many pulses are sent to track the flow and are separated by a fixed pulse repetition frequency.


Ultrasound Velocity Profiling (UVP) + Pressure Difference (PD)

An ultrasound Doppler echography technique (UVP) measures the flow profile in a pipe. From this the shear rate distribution in the pipe is determined.
A pressure drop measurement (PD) is used to determine the shear stress distribution in the pipe.


Unlike any other process rheometer that can only output viscosity at a single or few shear rates Incipientus output the complete multi-point rheogram (shear stress vs. shear rate). It is determined from a single flow profile and pressure measurement. The max shear rate depends on the flow rate in the pipe. The multi-point velocity profile and rheogram gives important benefits:
- The viscosity is measured across the actual range of shear rates
- The flow behaviour and velocity distribution of the product is determined under actual conditions
- More information is obtained compared to just getting the parameters from a model of the viscosity curve
Get in touch

Johan Wiklund
Sales
